

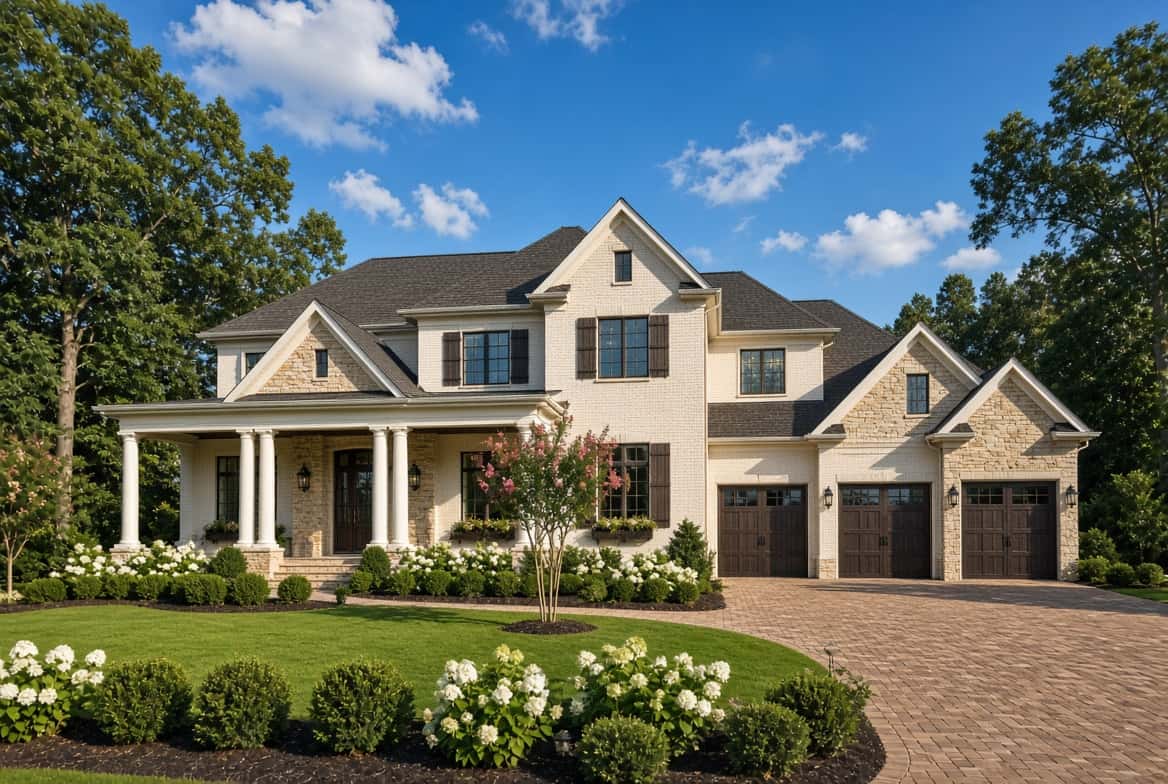
Two homes, both over a million dollars, both in North Fulton, both sold in the last twelve months. One went under contract in 34 days. In another community a few miles away, the typical home took 308.
That is not a market difference. It is the same market, the same year, the same price segment. It is a communitydifference, and it is large enough that any single “average days on market” number for North Fulton is close to useless for your address.
So I went through 422 closed sales above $1 million across 41 communities to find what actually separates the fast from the slow. The strongest pattern in the data is not size, and it is not price. It is the number most sellers reach for first — and most of them have it backwards.
The higher the price per square foot, the longer the wait.
Sellers tend to treat a high price per square foot as a scoreboard — evidence the neighborhood is desirable and the home is worth more. In this data it is also a reliable warning about your timeline.
Across all 41 communities, price per square foot tracks days on market at a correlation of r = 0.46. That is a stronger relationship than total sale price shows, and stronger than home size shows. Split the list in two and it is plain enough without any statistics: the ten communities with the highest price per square foot carry a median of 91 days on market. The ten lowest carry 45.
I want to be careful about how hard I lean on that, because you deserve the caveat as much as the finding. A correlation of 0.46 explains roughly 21% of what is happening. It is a tendency, not a law, and there are honest exceptions in both directions in the table below — Crabapple Crossroads sits in the priciest tenth per foot and still sold in 41 days, while Echelon is in the most affordable tenth and took 79.
But the direction is the opposite of what most sellers assume, and that is worth knowing before you set a price.
You are selling space, or you are selling location.
The explanation is not that expensive homes are overpriced. It is that a high price per square foot almost always means the buyer is paying for land, address and finish rather than for room — and in North Fulton, that is a narrower ask.
Set two communities in this data beside each other. Park Walke sells a median home of roughly 3,017 sq ft for $1,695,890. Heritage at Crabapple sells a median home of roughly 6,488 sq ft for $1,690,000. Those are comparable sums of money for wildly different products — and the second one moves in 34 days against 117.
Both homes will sell. But the number of buyers willing to spend seven figures on a smaller footprint in exchange for walkability or a premium address is genuinely smaller than the number who want the most house they can get. A narrower pool takes longer to find. That is arithmetic about buyers, not a judgment about the house.
I checked whether this was just an artifact of small communities producing noisy numbers. It is not — the number of sales in a community has essentially no relationship to how long its homes sit.
Every community, fastest to slowest.
Closed sales at or above $1 million, trailing 12 months to September 2026. Communities with fewer than 5 sales are left out so the medians mean something. The sale count is shown on every row for a reason: a community with nine sales is describing those nine sales, not a permanent truth about the neighborhood.
| Community | City | Days | $/sq ft | Median price | Sales |
|---|---|---|---|---|---|
| Heritage at Crabapple | Milton | 34 | $260 | $1,690,000 | 5 |
| Seven Oaks | Johns Creek | 34 | $218 | $1,191,250 | 10 |
| Oxford Mill | Johns Creek | 34 | $222 | $1,230,000 | 7 |
| Ellard | Alpharetta | 36 | $269 | $2,250,000 | 7 |
| Triple Crown | Milton | 38 | $251 | $1,837,500 | 6 |
| Providence at Atlanta National | Milton | 39 | $230 | $1,422,500 | 6 |
| Northcliff | Roswell | 40 | $260 | $1,300,000 | 5 |
| Crabapple Crossroads | Alpharetta | 41 | $337 | $1,060,000 | 5 |
| The Hermitage | Milton | 41 | $214 | $1,387,500 | 6 |
| Horseshoe Bend | Roswell | 43 | $203 | $1,140,000 | 11 |
| Chickering | Roswell | 44 | $225 | $1,065,000 | 6 |
| Glen Abbey | Alpharetta | 45 | $217 | $1,280,000 | 16 |
| Windward | Alpharetta | 48 | $238 | $1,287,900 | 36 |
| Manor North | Alpharetta | 48 | $237 | $1,250,000 | 7 |
| Sweet Apple | Milton | 48 | $359 | $1,900,000 | 5 |
| Bellmoore Park | Johns Creek | 48 | $284 | $1,300,000 | 7 |
| Crooked Creek | Milton | 49 | $226 | $1,295,000 | 25 |
| Nesbit Lakes | Alpharetta | 50 | $226 | $1,200,000 | 11 |
| Foundry | Alpharetta | 50 | $373 | $1,175,000 | 7 |
| Litchfield Hundred | Roswell | 50 | $234 | $1,422,500 | 14 |
| Sentinel on the River | Roswell | 50 | $160 | $1,165,000 | 7 |
| Kingsley Estates | Milton | 52 | $242 | $1,790,000 | 5 |
| Chartwell | Johns Creek | 56 | $217 | $1,243,000 | 7 |
| Hampton Hall | Alpharetta | 57 | $237 | $1,137,000 | 7 |
| East of Main | Alpharetta | 58 | $430 | $1,300,000 | 5 |
| White Columns | Milton | 62 | $258 | $1,525,000 | 21 |
| Grand Reserve | Roswell | 62 | $293 | $1,615,000 | 8 |
| St Ives | Johns Creek | 63 | $240 | $1,300,000 | 16 |
| The Falls of Autry Mill | Johns Creek | 64 | $235 | $1,450,000 | 15 |
| The Manor | Milton | 68 | $297 | $2,289,000 | 22 |
| Lakeside At Ansley | Roswell | 71 | $200 | $1,443,500 | 8 |
| Brookfield Country Club | Roswell | 71 | $305 | $1,250,000 | 8 |
| Echelon | Alpharetta | 79 | $220 | $2,575,000 | 5 |
| Avalon | Alpharetta | 82 | $534 | $1,362,500 | 9 |
| Country Club of the South | Alpharetta | 95 | $245 | $1,911,250 | 30 |
| Downtown Alpharetta | Alpharetta | 99 | $549 | $2,550,000 | 15 |
| Park Walke | Alpharetta | 117 | $562 | $1,695,890 | 7 |
| Historic Roswell | Roswell | 147 | $411 | $2,145,000 | 5 |
| Echo at Crabapple | Milton | 152 | $424 | $1,657,500 | 8 |
| Lakeview | Alpharetta | 211 | $331 | $1,177,184 | 5 |
| Aster | Roswell | 308 | $384 | $1,636,607 | 7 |
Source: First Multiple Listing Service (FMLS) closed sales, aggregated 2026-10-02. Community-level aggregates only — no individual sale is published. Median days on market is the midpoint, so half of the sales in a community took longer than the number shown.
Price per square foot is an output, not an input.
Here is the practical use of everything above. Price per square foot is what you get when you divide after a sale. It is not how you decide what to ask. Used as a pricing method it quietly assumes your home is the same product as whatever you compared it to, and this table is forty-three demonstrations that homes a few miles apart are not the same product.
If you are in a high-per-foot community: plan for a longer runway and price for it from day one. The most expensive version of this mistake is pricing as though you will sell in three weeks, then making two reductions in month four. The market reads the reductions, and you end up below where a patient, correct price would have landed.
If you are in a fast community: a home sitting well past your neighborhood’s median is telling you something early, while you still have options. That is worth acting on in week five rather than month five — and the answer is not automatically a price cut.
Either way, the median is not your house.Condition, land, layout, light, and what else is on the market the week you list will move your timeline more than your community’s median will. This table tells you the weather. It does not tell you what to wear.
Days on market, answered.
- How long does it take to sell a luxury home in North Fulton?
- It depends far more on which community you are in than on the market as a whole. Across 41 communities and 422 closed sales above $1 million in the twelve months to September 2026, median days on market ranged from 34 days in Heritage at Crabapple to 308 days in Aster. That is a spread of roughly 9× inside the same county and the same price segment. Anyone quoting you a single "average days on market" for North Fulton is flattening a range wide enough to make the average close to meaningless for your specific address.
- Do homes with a higher price per square foot take longer to sell?
- In this dataset, yes — it is the clearest pattern in the numbers. Median price per square foot correlates with median days on market at r = 0.46 across 41 communities, which is a stronger relationship than either total sale price or home size shows. The ten communities with the highest price per square foot carry a median of 91 days on market; the ten lowest carry 45. It is a tendency rather than a rule — a correlation of that size explains roughly 21% of what is going on, and there are real exceptions in both directions — but it runs opposite to the intuition that a higher per-foot value is straightforwardly good news.
- Why would an expensive home per square foot sell more slowly?
- Because a high price per square foot usually means the buyer is paying for land, location and finish rather than for space — and in North Fulton that is a narrower ask. Compare two communities in this data: Park Walke has a median around 3,017 sq ft at $1,695,890, while Heritage at Crabapple has a median around 6,488 sq ft at $1,690,000. Those are close in total dollars and completely different products. The pool of buyers who will spend seven figures on a smaller footprint in exchange for walkability or a premium address is genuinely smaller than the pool that wants maximum house, and a smaller pool takes longer to find. It is not a defect in the home. It is arithmetic about the buyer pool.
- Which North Fulton communities sell the fastest?
- In the twelve months to September 2026, the fastest were Heritage at Crabapple (34 days), Seven Oaks (34 days), Oxford Mill (34 days), Ellard (36 days), Triple Crown (38 days). What they have in common is instructive: every one of them sits in the middle of the price-per-square-foot range rather than at the top. These are established communities selling substantial detached homes at a per-foot number buyers recognise as fair, which is the combination that moves fastest in this market.
- Which North Fulton communities take the longest to sell?
- The slowest in this window were Aster (308 days), Lakeview (211 days), Echo at Crabapple (152 days), Historic Roswell (147 days), Park Walke (117 days). Read those with care: several rest on single-digit sale counts, so they describe those particular sales rather than a permanent characteristic of the neighborhood. A long median in a thin community can be one unusual listing. That caution cuts both ways — it is also why you should not price your home off a neighbour's fast sale.
- Should I use price per square foot to price my home?
- Not as your primary tool, and this data is a good illustration of why. Price per square foot is an output of a sale, not an input to one — it is what you get when you divide afterwards. Used as a pricing method it silently assumes your home is the same product as whatever you are comparing it to, and the numbers here show communities a few miles apart selling at $200 and $500 per foot for reasons that have nothing to do with either home's merit. What actually prices a home is condition, land, layout, light, the specific competing inventory the week you list, and how the last three genuinely comparable sales transacted. That is a comparative market analysis, and it is address-specific work.
- What is a normal days on market for a $1M+ home in Alpharetta or Milton?
- There is a usable range rather than a single number. Most communities in this dataset cluster between roughly 40 and 95 days, with outliers at both ends. If you are being told to expect a two-week sale on a seven-figure home, that is an outlier being sold to you as a norm. If your home has been out for six months in a community whose median is under sixty days, that is worth a real conversation about price, presentation, or both — and the answer is not automatically a price cut.
- How current is this data and where does it come from?
- It comes from First Multiple Listing Service (FMLS) closed-sale records, aggregated across the trailing 12 months to September 2026, covering sales at or above $1 million. Communities with fewer than 5 sales in the window are omitted entirely so the medians stay meaningful. No individual sale is published here — only community-level aggregates. The figures refresh with the monthly market report rather than being typed in once and left to go stale.
For the month-by-month view of the same market, see the North Fulton luxury market report, updated monthly. For how pricing strategy actually works on a specific home, see how to price a luxury home.
A median can’t price your house.
Everything above is the backdrop. What it cannot tell you is what your specific home should ask, how long it should realistically take, and which of the last twelve months of sales are genuinely comparable to yours.
That is the work — and after thirty years selling across Alpharetta, Milton, Roswell and Johns Creek, it is work I would rather do properly than approximate with a multiple. Tell me your address and your timing, and I’ll give you a straight read.